Selecting the proper surface finish of a part is a balancing act, especially coming from different perspectives. Imagine using strange symbols hidden behind technical math formulas and unwelcome charts. Eventually, choosing the wrong finish can come back to haunt you through inefficient operations, money loss, or significant component failure.
That is exactly why we have worked on this simple yet amazing guide based on facts and logic from the surface roughness chart. Whether you are making or inspecting design documents, this guide will assist you in thoroughly understanding roughness charts. Let’s dive in!
1) Understanding the Surface Roughness Chart?
A surface roughness chart describes the texture of a machined or finished part in terms of its smoothness or roughness. It depicts different textures using Ra values, symbols, and specific types of finishes.
Well, for those working with CNC machines, metal components, or in product planning, this chart assists in determining the correct finish for the component as per functional requirements or aesthetic standards.
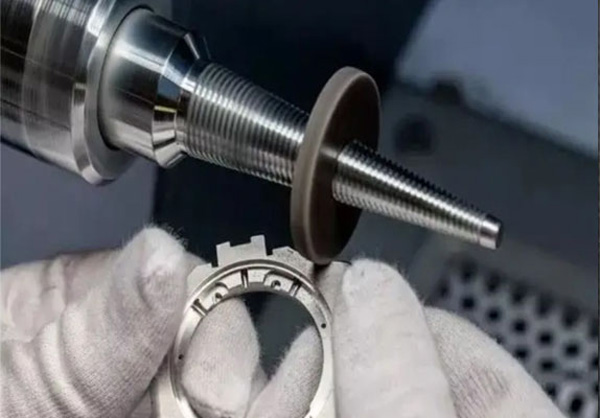
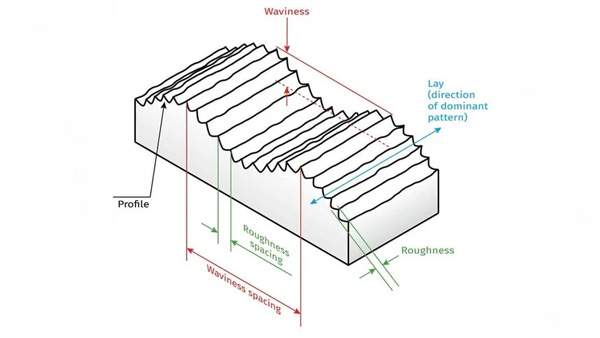
During cutting, milling, or grinding operations on metals and plastics, these surfaces do not always result in a shine that is completely smooth to the touch. Shiny parts like surface plates also hold tiny peaks and valleys that influence their fitting, movement and wear. For this purpose, a surface measure system known as Surface Roughness comes into play.
The international standard ISO 4287 defines the surface finishing parameters, like Ra and Rz. Alright! The cross-section of a surface finish comparison chart allows complex evaluation of numerous parameters defining the required level of smoothness during part making.
Each part has its own finishing requirements. An example could be that a medical component would require different surface finishing as opposed to an engine bracket. A rough finish would bring excessive friction or poor sealing, while overspending on smooth finishing would waste unnecessary time and resources.
This is the reason why the surface finish roughness chart is beneficial, highlighting the comparison between coarse grinding to mirror polishing.
As for beginners, these charts may seem puzzling at first glance. However, with some help, they’re simple to navigate. Numerous manufacturing services, such as LTC Proto, offer surface finishing options, which enable customers to set their requirements seamlessly and without hassle.
So, while designing, prototyping or inspecting a part, you can rely on the roughness comparison chart to make critical decisions. The surface finish not only ensures the quality of parts but also guarantees their efficient performance.
2) What are Ra Values and Surface Finish Symbols
While using a surface roughness chart, one of the first things you might see is the Ra value. The Ra or Roughness Average is arguably the most common measurement of surface roughness. It measures how smooth or rough a surface is by averaging out all of the tiny peaks and valleys that exist on it.
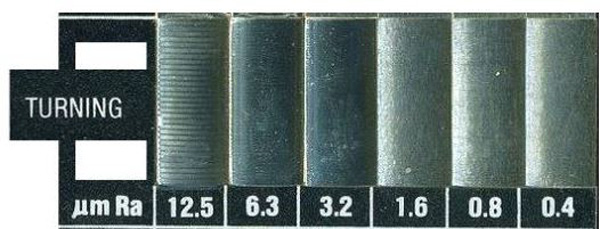
Ra can be expressed in µm or µin. For instance, a Ra value of 3.2 µm indicates a comparatively rougher surface than 0.4 µm, which indicates a finer and polished finish. Such values are captured in a roughness chart alongside different finishes to provide a visual comparison.
Along with Ra values, symbols depicting requisite surface finish are frequently found on technical drawings. These surface finish symbols resemble a checkmark or triangular letter (∠) drawing, sometimes accompanied by numbers.
Here’s a quick overview of the common Ra values and their uses:
| Ra Value (µm) | Surface Finish Type | Typical Use |
| 3.2 | Rough machining | Structural parts, general surfaces |
| 1.6 | Standard machining finish | Mechanical parts, brackets |
| 0.8 | Fine machining | Shafts, sealing areas |
| 0.4 | Very fine finish | Bearings, sliding parts |
| 0.2 | Near-mirror polishing | Optical parts, medical tools |
At LTC Proto and similar CNC shops, quoting options are available for you to select as finishes during the quoting stage, so that every surface is given the right Ra value.
3) What are the Ways to Measure Surface Roughness?
Achieving a desired Ra value calls for measuring it with precision tools dedicated to measuring the rough or smooth surfaces of an object. It can be made easier by using portable mapping systems alongside a surface roughness chart, which will eliminate guesswork when working around problem areas.
A smooth surface can still have small bumps that lead to issues. They can bring challenges regarding the fitting of components, their functioning, and even their longevity. Thus, roughness measurements are very essential in CNC machining, metalworking, and also in manufacturing plastic parts.
i) Profilometer
The most common tool used is a profilometer. It measures surface irregularities by sliding a sensor over the surface.
- Two main types exist:
Contact profilometers: These utilise a stylus that rolls over the edges of the surface to document the highs and lows. Although highly precise, they are not meant for soft or delicate pieces.
Non-contact profilometers: These utilise lasers or light to scan surfaces without physical contact. They are ideal for shiny or delicate pieces as they are fast.
For measuring and comparing with Ra charts, profilometers calculate the Ra value based on measurements taken. Some advanced devices aid in detecting 3D models for relevant surfaces, thus helping capture finer marks or uneven textures that could hinder efficient performance.
These instruments find application across various industries like automotive, aerospace, medical devices and electronics, including inspection areas and QC divisions.
ii) Surface Comparison Method
This is a straightforward technique to estimate surface finishing. All you need to do is take your part and compare it to reference plates or blocks from a surface finish roughness chart. Each block features a known Ra value, which provides a standard for comparing different parts.
Although not accurate, this approach is useful in initial assessments, especially on the shop floor. It is also cheaper for small workshops and during quick prototyping.
iii) Tactile Testing by Hand
A few skilled machinists can use their hands to determine the roughness of a surface; such knowledge comes with practice spanning over many years. While it can assist in swift evaluations, no matter how experienced one is, this method should never be used as the primary method during final assessments.
You can differentiate between a 3.2 µm surface and a 0.4 µm one, but anything closer than that becomes impossible to judge without sophisticated tools.
Well, the good thing is that reputable firms like LTC Proto offer calibrated instruments such as micrometers that layer differing surfaces on objects with contours, enabling precise measuring of the parts’ surfaces. So, it ensures that each component aligns perfectly with requirements.
4) Surface Roughness Units and Their Conversions
You will often come across surface roughness charts that have two different units stated. These units are micrometres (µm) and microinches (µin). Both of these units measure the smoothness or roughness of a surface; however, one is used in Europe and Asia, whereas the other is mostly used in America.
Roughness average stated as Ra is the common unit found worldwide. It denotes the average height of surface bumps and valleys. One can find almost all surfaces with their Ra value mentioned in the offered charts. Moreover, low values indicate a smoother surface.
So, it is very important to know and understand all international suppliers due to their mix.
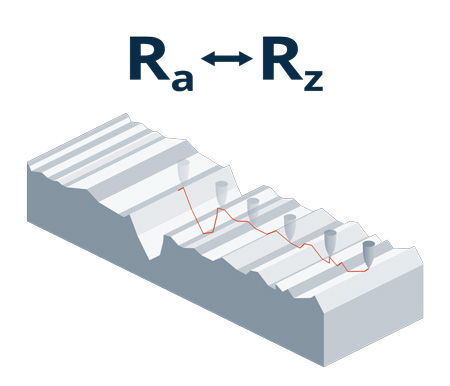
Another useful measurement: Rz
While Ra indicates the average roughness, Rz reveals the total height deviation from the highest peak to the deepest trough over a given sampling length. It helps determine whether crucial deep cuts or spikes that can impact the functionality of a component are present.
There are some industries that prefer Rz because it is more informative regarding surface texture detail.
Roughness Conversion Table
Your understanding of Ra and Rz values can be simplified through this comparison chart. This shows the definition of each level along with its corresponding measurements.
| Ra (µm) | Ra (µin) | Rz (µm) |
| 3.2 | 125 | 12.5 |
| 1.6 | 63 | 6.3 |
| 0.8 | 32 | 3.2 |
| 0.4 | 16 | 1.6 |
| 0.2 | 8 | 0.8 |
Like already discussed above, the use of micromeres is very predominant outside the United States. Despite this fact, though, the difference between both systems is maintained globally, ensuring ease through the use of conversion tables or even finish charts.
- Why These Conversions Matter
Avoiding mix-ups is easier when using the right units, as demonstrated here: if a polish is requested to have a 63 Ra finish and the supplier reads it as 63 µm, the end result would likely be too rough because it would exceed the required measurement by a significant amount.
This is why top-tier services like LTC Proto follow global standards, because this finish selection allows you to choose between scales in micrometres or even microinches, granting full flexibility on how detailed the polish should be.
Keeping an order or check surface peculiarities chart always enhances accuracy and precision, ensuring your measurements are consistent no matter what.
5) Practical tips to Understand a Surface roughness Chart
If you’re just starting out in machining and part designing, a surface roughness chart can be quite intimidating as it contains numbers, units, and strange words. But after understanding the basics, the chart turns into a helpful aid when trying to avoid mistakes while selecting the correct finishing procedure.
To help improve your confidence while reading this chart, we have put together some easy-to-follow tips:
- Start with Ra Values
If you have no starting point, we recommend using Ra values as a baseline. Roughness Average (Ra) is by far the most used metric value of a surface finish chart. Lower than 0.2 µm cannot go smoother, while 3.2 µm suggests a considerable roughness difference. Yes, most general requirements will be adequately served by Ra values alone.
- Know the Units
Always keep an eye lest surface roughness measurements of either µm (micrometres) or µin (microinches) are erroneously interchanged.
Due to ongoing engineering endeavours, it is very common to see a roughness conversion ratio printout posted or bookmarked on system desktop screens for rush access.
- Finish Types and Recommended Usage
Not all components require attention to surface finishing or polishing at the same level. Each part should be dressed according to its function. Moving parts like seals and medical instruments require smooth finishes, while hidden stationary components can retain rougher finishes.
- Adhere Symbols on Drawings and Corresponding Finishes
Drawings have symbols indicating surface finish requirements. Most of them will bear a symbol but capped with a triangle or an angle sign (∠) with particular numbers inscribed beside it. That number shows the required Ra value. The Surface Roughness Chart can be used to aid in achieving appropriate levels of finishing for the part.
- Never Hesitate To Seek Help
Your manufacturer or CNC provider should always be your first inquiry when something is not clear to you. Reliable providers such as LTC Proto assist the clients not just during processing but throughout the selected service lifecycle. We actively support our users by guiding them towards the proper selection of a surface that best fits.
Okay, with a little practice, a surface roughness chart can become a natural and necessary part of your machining process. Just ask questions, plan keenly, and keep a chart nearby; it will really make a significant difference!
6) Final Words
Knowing how to read a surface roughness chart allows you to design better parts while simultaneously aiding the machining and inspection processes by eliminating unnecessary decision-making regarding post-processed surfaces. It provides certainty in dealing with performance-critical components and finishes where accuracy matters.
Time is saved when mistakes are eliminated, leading to improved quality as precision increases by simply learning how graphically paired Ra values can be read. Reliable partners such as LTC Proto offer precise surface finishing services, wonderfully aligned with project requirements, further bolstering confidence. So, Get a Quote from LTC Proto right now!